
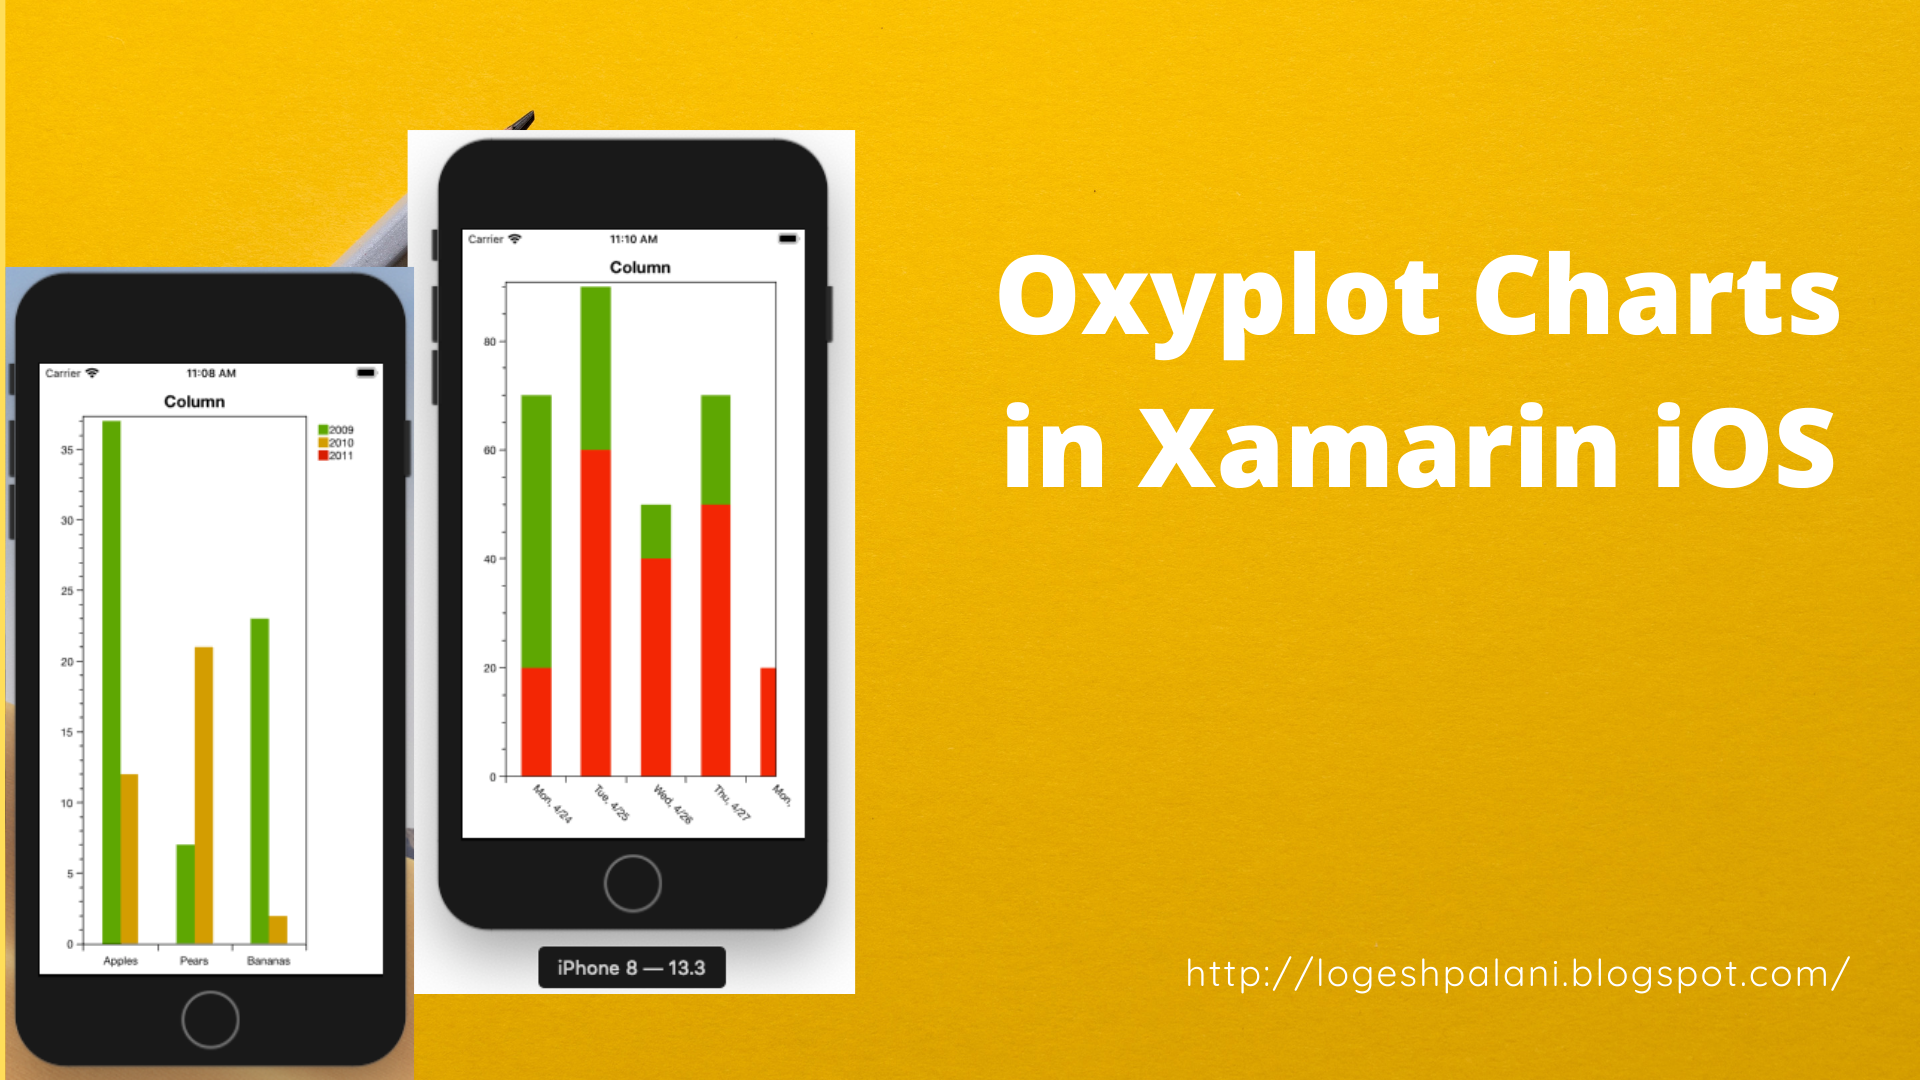
How To Use Oxyplot Chart in Xamarin iOS
Introduction
Showing data in a chart/graph is much easier to understand. In Xamarin iOS no default option to show the chart. We must use a third-party plugin to show charts. A lot of third-party plugins are paid like Syncfusion, Telerik. I recommend using Oxyplot charts because it’s full of open-source and easy to use this in your project. In this article, we are going to learn how to use and understand the Oxyplot chart in Xamarin.iOS Project.
Let’s start,
Create Xamarin iOS Single View Application in Visual Studio for Mac
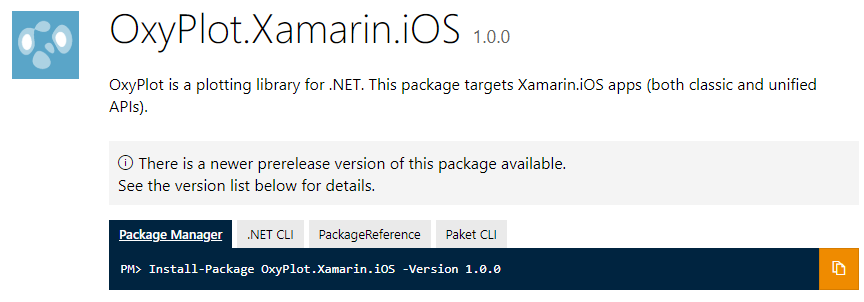
Before start designing, we must install an Oxyplot chart plugin from NuGet Manager in your project.
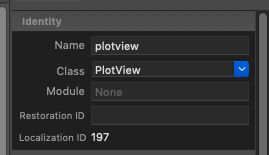
Now, open Main.Storyboard in Visual Studio designer and drag the View from Toolbox and place as per your requirement and apply class as PlotView in the properties window and set identity Name [Eg – plotview]
Next, write your code in ViewController.cs file. Here the many different types of chart API will be available for use like Bar, Stack, Function, Pie Chart and etc,.
Here, Create PlotModel and set required properties as per your requirement and create the X, Y-axis, position, labels, zoom, angle, Max, Min, and other properties.
- The Zoom property for the zoom level of the chart.
- The Max, Min properties for avoiding more scrolling in the non-data representation in the chart, I mean you set min level is a zero, it will avoid minus(-) side-scrolling, because, we don’t have data representation on minus side.
- The Position property used to set the position of chart in the top, bottom, left or right side
Afterward, create Axis and Data Column Series. In the Column series also have different properties like color, width and etc,. Apply this X, Y-Axis and Column series to this PlotModel as we created first. Finally set this plotModel to PlotView as we designed in the Storyboard scene. Here is the full source code.
using System;
using System.Collections.ObjectModel;
using CoreGraphics;
using OxyPlot;
using OxyPlot.Axes;
using OxyPlot.Series;
using UIKit;
namespace chartsDemo
{
public partial class ViewController : UIViewController
{
public ViewController(IntPtr handle) : base(handle)
{
}
public override void ViewDidLoad()
{
base.ViewDidLoad();
// Perform any additional setup after loading the view, typically from a nib.
var model = new PlotModel()
{
Title = "Column",
PlotType = PlotType.XY,
LegendSymbolLength = 5,
LegendPlacement = LegendPlacement.Outside,
LegendOrientation = LegendOrientation.Vertical,
};
CategoryAxis xaxis = new CategoryAxis();
xaxis.Position = AxisPosition.Bottom;
xaxis.Labels.Add("Mon, 4/24");
xaxis.Labels.Add("Tue, 4/25");
xaxis.Labels.Add("Wed, 4/26");
xaxis.Labels.Add("Thu, 4/27");
xaxis.Labels.Add("Mon, 4/24");
xaxis.Labels.Add("Tue, 4/25");
xaxis.AbsoluteMinimum = -.5;
xaxis.AbsoluteMaximum = 6;
xaxis.Zoom(0, 4.5);
xaxis.Angle = 45;
LinearAxis yaxis = new LinearAxis();
yaxis.Position = AxisPosition.Left;
yaxis.AbsoluteMinimum = 0;
yaxis.MinimumPadding = 0;
yaxis.AbsoluteMaximum = 100;
ColumnSeries s1 = new ColumnSeries();
s1.IsStacked = true;
s1.Items.Add(new ColumnItem(20));
s1.Items.Add(new ColumnItem(60));
s1.Items.Add(new ColumnItem(40));
s1.Items.Add(new ColumnItem(50));
s1.Items.Add(new ColumnItem(20));
s1.Items.Add(new ColumnItem(60));
s1.ColumnWidth = 20;
s1.FillColor = OxyColor.FromRgb(255, 0, 0);
ColumnSeries s2 = new ColumnSeries();
s2.IsStacked = true;
s2.Items.Add(new ColumnItem(50));
s2.Items.Add(new ColumnItem(30));
s2.Items.Add(new ColumnItem(10));
s2.Items.Add(new ColumnItem(20));
s2.ColumnWidth = 20;
model.Axes.Add(xaxis);
model.Axes.Add(xaxis1);
model.Series.Add(s1);
model.Series.Add(s2);
this.plotview.Model = model;
plotview.Frame = new CGRect(0, 0, this.View.Frame.Width + 20, this.View.Frame.Height);
}
public override void DidReceiveMemoryWarning()
{
base.DidReceiveMemoryWarning();
// Release any cached data, images, etc that aren't in use.
}
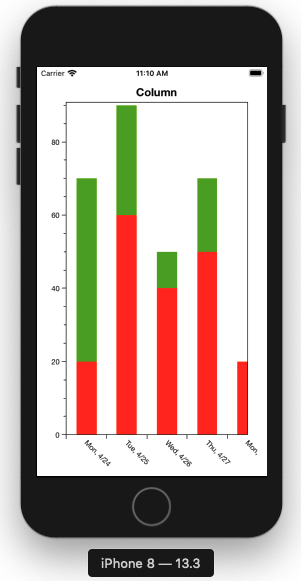
}
}Now, you can execute the project and the output like below.
Next, create another type of chart. Create a new Model named item.cs and write the below-given code.
namespace chartsDemo
{
    internal class Item
    {
        public string Label { get; set; }
        public int Value1 { get; set; }
        public int Value2 { get; set; }
        public int Value3 { get; set; }
    }
}
As usual use bar Charts and apply item model values to this plot chart. The code is given below.
using System;
using System.Collections.ObjectModel;
using CoreGraphics;
using OxyPlot;
using OxyPlot.Axes;
using OxyPlot.Series;
using UIKit;

namespace chartsDemo
{
    public partial class ViewController : UIViewController
    {
        public ViewController(IntPtr handle) : base(handle)
        {
        }

        public override void ViewDidLoad()
        {
            base.ViewDidLoad();
            // Perform any additional setup after loading the view, typically from a nib.

            var model = new PlotModel()
            {
                Title = "Column",
                PlotType = PlotType.XY,
                LegendSymbolLength = 5,
                LegendPlacement = LegendPlacement.Outside,
                LegendOrientation = LegendOrientation.Vertical,
            };

            CategoryAxis xaxis = new CategoryAxis();
            xaxis.Position = AxisPosition.Bottom;
            xaxis.Labels.Add("Mon, 4/24");
            xaxis.Labels.Add("Tue, 4/25");
            xaxis.Labels.Add("Wed, 4/26");
            xaxis.Labels.Add("Thu, 4/27");
            xaxis.Labels.Add("Mon, 4/24");
            xaxis.Labels.Add("Tue, 4/25");
            xaxis.AbsoluteMinimum = -.5;
            xaxis.AbsoluteMaximum = 6;
            xaxis.Zoom(0, 4.5);
            xaxis.Angle = 45;

            LinearAxis yaxis = new LinearAxis();
            yaxis.Position = AxisPosition.Left;
            yaxis.AbsoluteMinimum = 0;
            yaxis.MinimumPadding = 0;
            yaxis.AbsoluteMaximum = 100;

            ColumnSeries s1 = new ColumnSeries();
            s1.IsStacked = true;
            s1.Items.Add(new ColumnItem(20));
            s1.Items.Add(new ColumnItem(60));
            s1.Items.Add(new ColumnItem(40));
            s1.Items.Add(new ColumnItem(50));
            s1.Items.Add(new ColumnItem(20));
            s1.Items.Add(new ColumnItem(60));

            s1.ColumnWidth = 20;
            s1.FillColor = OxyColor.FromRgb(255, 0, 0);

            ColumnSeries s2 = new ColumnSeries();
            s2.IsStacked = true;
            s2.Items.Add(new ColumnItem(50));
            s2.Items.Add(new ColumnItem(30));
            s2.Items.Add(new ColumnItem(10));
            s2.Items.Add(new ColumnItem(20));
            s2.ColumnWidth = 20;

            var Items = new Collection<Item>
            {
                new Item {Label = "Apples", Value1 = 37, Value2 = 12},
                new Item {Label = "Pears", Value1 = 7, Value2 = 21},
                new Item {Label = "Bananas", Value1 = 23, Value2 = 2}
            };

            model.Axes.Add(new CategoryAxis { ItemsSource = Items, LabelField = "Label", AbsoluteMinimum = -0.5 });
            model.Axes.Add(new LinearAxis { Position = AxisPosition.Left, MinimumPadding = 0, AbsoluteMinimum = 0 });
            model.Series.Add(new ColumnSeries { Title = "2009", ItemsSource = Items, ValueField = "Value1", ColumnWidth = 20 });
            model.Series.Add(new ColumnSeries { Title = "2010", ItemsSource = Items, ValueField = "Value2", ColumnWidth = 20 });
            model.Series.Add(new ColumnSeries { Title = "2011", ItemsSource = Items, ValueField = "Value3" });

            this.plotview.Model = model;
            plotview.Frame = new CGRect(0, 0, this.View.Frame.Width + 20, this.View.Frame.Height);

        }

        public override void DidReceiveMemoryWarning()
        {
            base.DidReceiveMemoryWarning();
            // Release any cached data, images, etc that aren't in use.
        }
    }
}
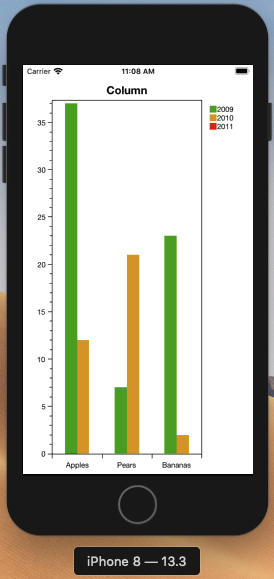
Run your project by pressing F5, you will get output like below.
The Full source code in Github
Summary
- Install Xamarin.iOS.Oxtplot Plugin
- Place View and apply PlotView class
- Create PlotModel, Column Series, X and Y-Axis
- Apply to PlotView
Thanks for reading.